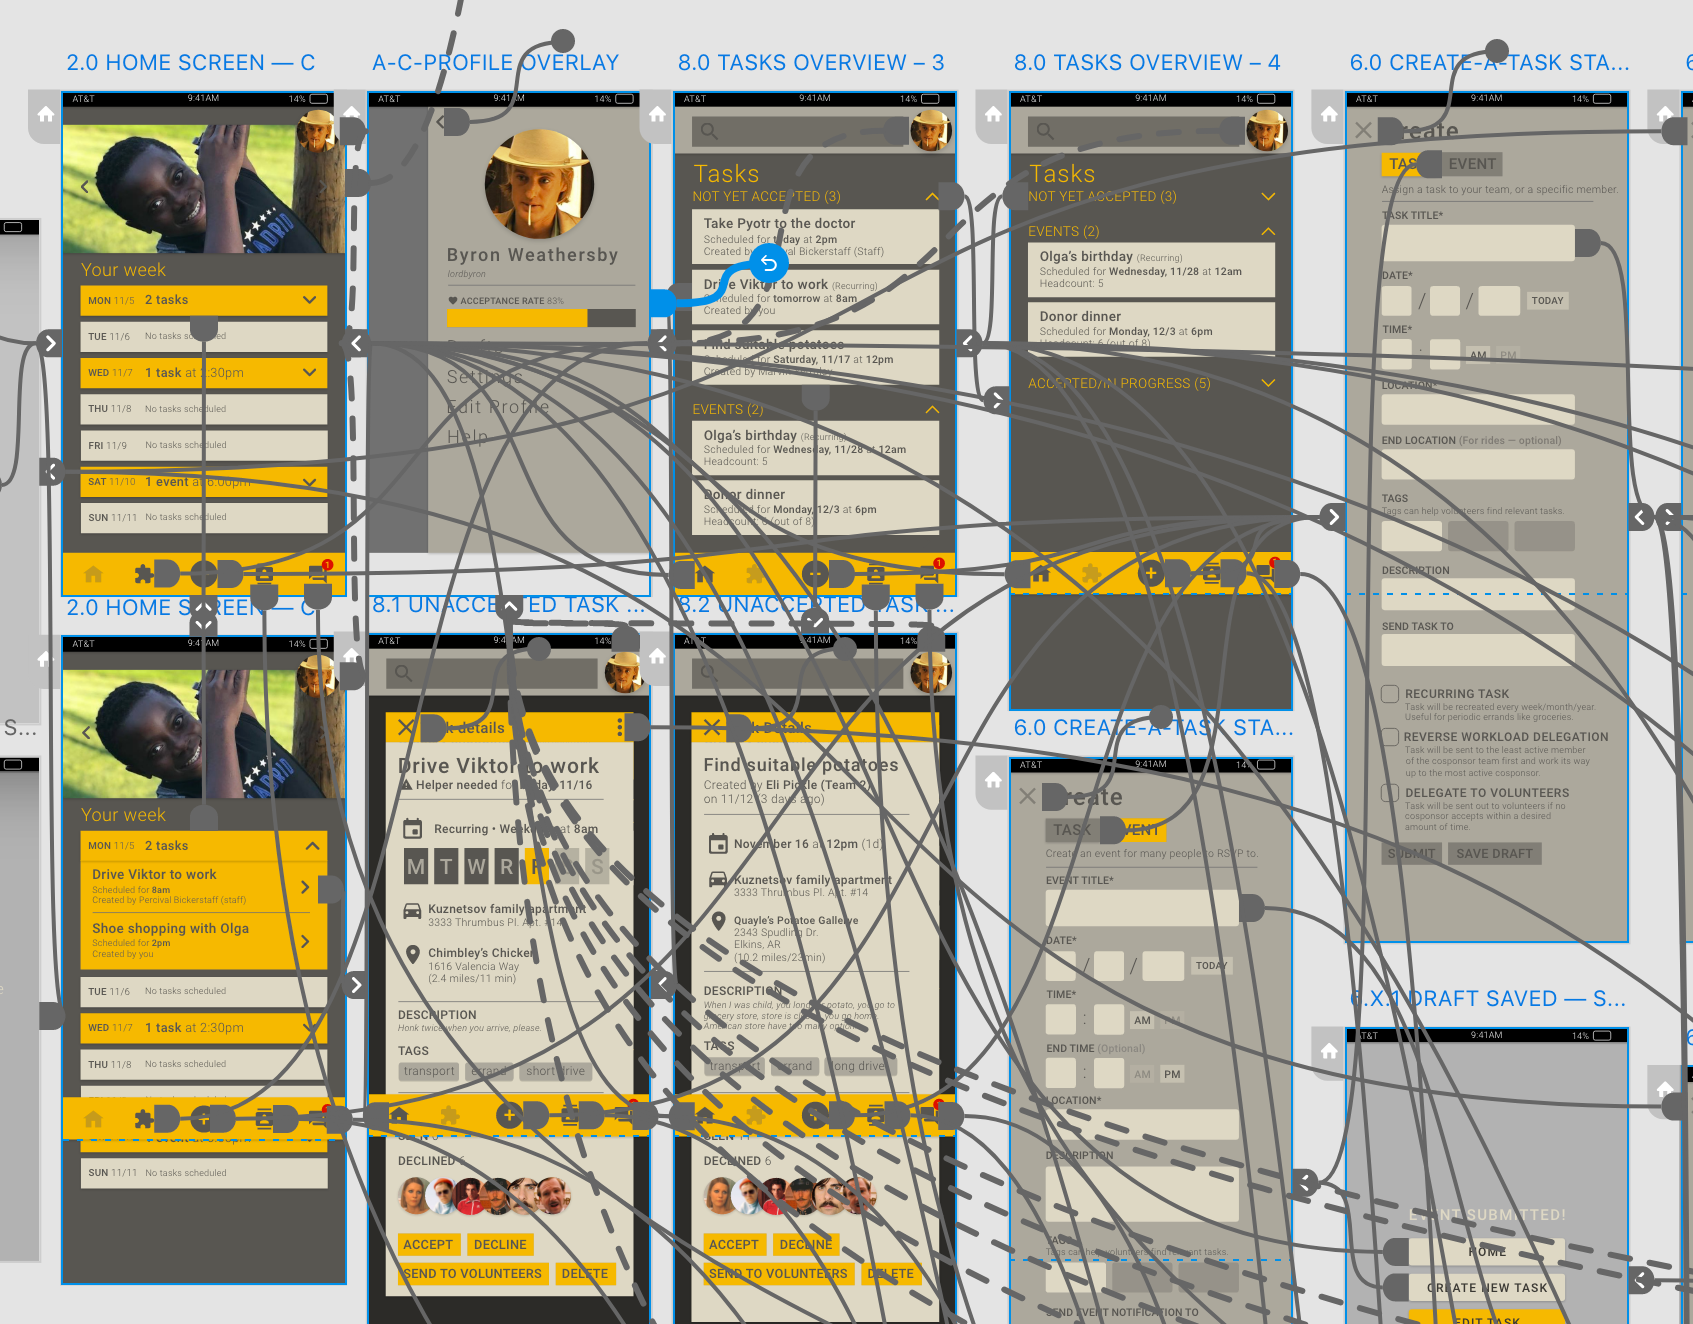
This massive poster tells the story of my life from 2014–2019, spanning some of high school and most of college. This was my first serious foray into data visualization (although it really stretches that term). I completed this project with the help of Bree McMahon, one of the most encouraging and empowering professors and human beings I've ever met. I wanted this project to be as complicated, unwieldy, dense, and meandering as the story it tells, and Bree pushed me to pursue it to its fullest potential.
This is meant to be read closely. There's a lot to take in here, but the instructions, color-coding, arrows, and numbers should guide you fairly well.
DISCIPLINES
Data visualization, print
TOOLS
Adobe Illustrator